North Recharge

WATER YEAR 2026 | SYSTEM UPDATED: 2025-12-17 13:52
← Back to Region

The Siege of the Aquifers

The aquifers of the San Luis Valley are under constant siege. They are a finite bank account where nature makes deposits (Recharge) and both nature and humans make withdrawals (Discharge).

The Balance is Delicate: Unlike a surface reservoir, you cannot see the water level drop until it is too late. The "Water Balance Model" below reveals the hidden mathematics that determine whether our aquifers rise or fall.

USGS Water Balance Model

The Projection Engine

Rtotal = Rmtn + Rstream + Rirr - ET - Qout
Rmtn (Mountain-Front Recharge)

Snowpack & Precip entering from the basin edges.

  • West (San Juans): High Efficiency (Permeable Volcanics).
  • East (Sangres): Low Efficiency (Steep, less permeable).
Rstream (Stream Infiltration)

River water soaking into alluvial fans.

  • High Flow: Water extends past the fan -> Recharge.
  • Low Flow: Water stalls -> Evaporation (100% Loss).
ET (Evapotranspiration)

The "Killer Variable". Plants & Sun.

  • Removes ~2,800,000 AF/year from the valley.
  • Penalty: -20 inches/year subtracted from the budget.
Rirr (Irrigation Return)

The Human Element.

  • Diverted river water that seeps back into the shallow aquifer.
  • Critical during May-Sept irrigation season.
⚠️ ALERT SYSTEM
If Summer Precip < 0.2 inches -> Recharge is set to ZERO.

Aquifer Geology (USGS)
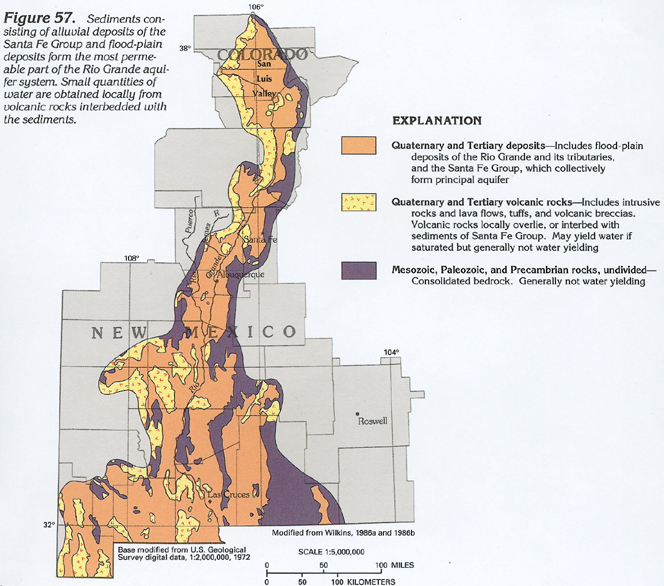
USGS Aquifer Map

Hydrogeologic Units

USGS Cross Section

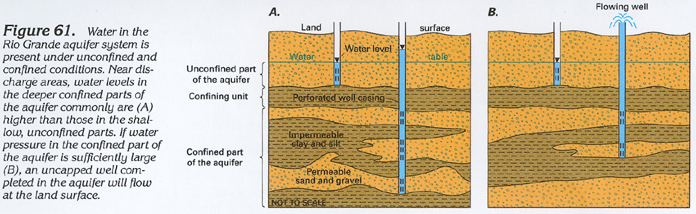
Valley Cross Section

USGS Groundwater Flow

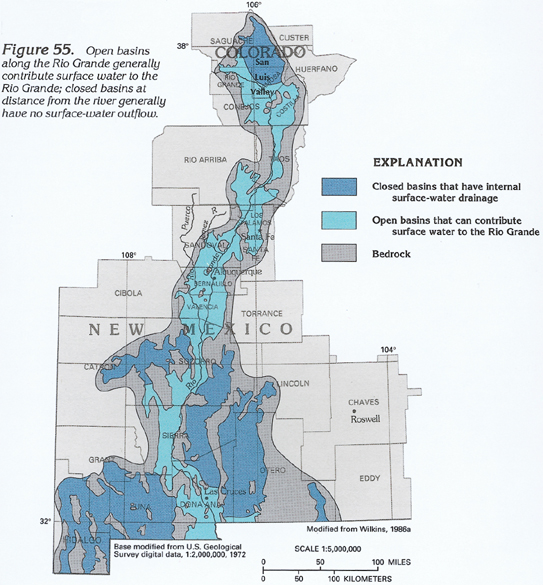
Groundwater Flow Direction
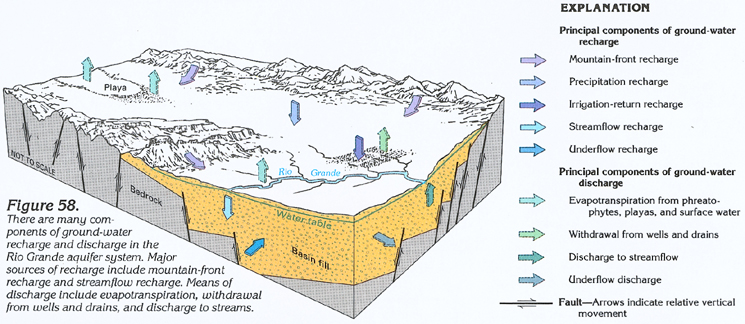
USGS Discharge Areas

Discharge Areas

Basin Wide

[ THE BOTTOM LINE ] A calculated index of net aquifer recharge. This metric weighs precipitation and infiltration against extraction to determine if the basin's savings account is growing or shrinking.